A mind map is a diagram used to visually organize information. A mind map is often created around a single concept, drawn as an image in the center of a blank landscape page, to which associated representations of ideas such as images, words and parts of words are added. Major ideas are connected directly to the central concept, and other ideas branch out from those.
Mind maps can be drawn by hand, either as “rough notes” during a lecture, meeting or planning session, for example, or as higher quality pictures when more time is available.
Although the term “mind map” was first popularized by British popular psychology author and television personality Tony Buzan, the use of diagrams that visually “map” information using branching and radial maps traces back centuries. These pictorial methods record knowledge and model systems, and have a long history in learning, brainstorming, memory, visual thinking, and problem solving by educators, engineers, psychologists, and others. Some of the earliest examples of such graphical records were developed by Porphyry of Tyros, a noted thinker of the 3rd century, as he graphically visualized the concept categories of Aristotle. Philosopher Ramon Llull.
Suggestions to following guidelines for creating mind maps:
- Start in the center with an image of the topic, using at least 3 colors.
- Use images, symbols, codes, and dimensions throughout your mind map.
- Select key words and print using upper or lower case letters.
- Each word/image is best alone and sitting on its own line.
- The lines should be connected, starting from the central image. The lines become thinner as they radiate out from the center.
- Make the lines the same length as the word/image they support.
- Use multiple colors throughout the mind map, for visual stimulation and also for encoding or grouping.
- Develop your own personal style of mind mapping.
- Use emphasis and show associations in your mind map.
- Keep the mind map clear by using radial hierarchy or outlines to embrace your branches.
Mind-mapping software can be used to organize large amounts of information, combining spatial organization, dynamic hierarchical structuring and node folding. Software packages can extend the concept of mind-mapping by allowing individuals to map more than thoughts and ideas with information on their computers and the Internet, like spreadsheets, documents, Internet sites and images. It has been suggested that mind-mapping can improve learning/study efficiency up to 15% over conventional note-taking.
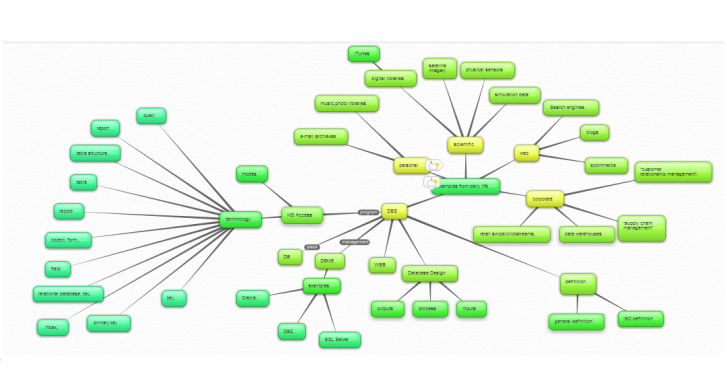
Below You can find an example of my own mind map created in the program bubble.us.
It is very hepfull tool in studying.

Attached picture of mind map, is a mind map based on the first lecture of Information Technologies.
Our mind map describes the relationships in the topic of Databes, Database Management System (DBMS), Database System (DBS).
In the center of our mind map we situated a DATABASE SYSTEM, then we built our M.P basing on logical connection of each part of DBS.
Database intuitively: „place“ where we store our data in electronic form
ISO definition : a collection of interrelated data stored together in one or more computerized files. (ISO/IEC 24765, Systems and Software Engineering Vocabulary)
In general: A logically organized collection of related data designed and built for a specific purpose.
Database Management System (DBMS) is: – A software designed to store, manage, and facilitate access to databases. – It provides interface between database and application program
Database system (DBS)
It works according to the equation: DBS = DB + DBMS
Data are organized in database (DB) and managed by database management system (DBMS)
Good work!! Keep on doing!!
LikeLike
Great idea!
LikeLiked by 1 person